The team at 360 Digitalize truly exceeded our expectations. The team is truly an expert in data analytics and management. They helped us uncover valuable insights that were overlooked by us previously.
Sandra Fernandes
With the help of your advanced data visualization techniques, we are able to understand complex data quickly and we are able to make informed decisions efficiently.
Jonathan Dias
The team transformed the raw data into visually stunning, easy-to-understand, and user-friendly dashboards. We are able to communicate complex data with ease.
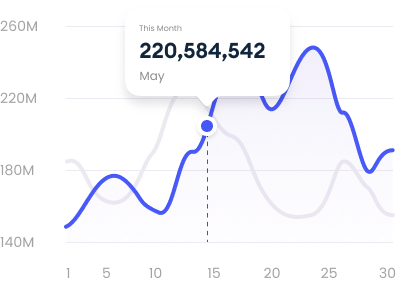
Harness the power of data visualizations, a common and effective method for presenting business intelligence. Integrated into dashboards, they swiftly convey insights, revealing trends and patterns that may elude manual analysis of raw data. With 360 Digitalize, we’ll customize visualizations and dashboards for your team, prioritizing data security through tailored security permissions for BI users. Let’s elevate your business impact through data-driven insights!
Custom Visualization Solutions
We specialize in outlining business requirements and crafting precise use cases. Our expertise extends to creating customized data visualization platforms from the ground up, ensuring alignment with our clients' distinct objectives and requirements.
Data Visualization Tools
Training and Education
Experimental Visualizations
Data Visualization Re-Engineering
Experts in data visualization re-engineering possess the proficiency to evaluate existing data visualization solutions. They adeptly enhance previous tools by integrating new and advanced features. When needed, they can also restructure or migrate existing solutions to more suitable platforms.
Data Security
Data Transparency
Data Cleaning and Preparation
Turn Numbers into Insights
Our team's data visualization software serves as a transformative tool, turning complex numerical data—often buried within endless spreadsheets—into dynamic and intuitive dashboards, visual reports, and charts. Our solution allows you to unlock the full potential of your data, gaining deeper insights and making informed decisions with ease.
Enhance Your Storytelling
Unlock the power of storytelling with our solutions tailored to amplify your data journey. From user-friendly interfaces to compelling narratives, we ensure seamless data interaction and understanding. Empower your business to communicate insights and strategies effectively through captivating data stories. Are you ready to transform your data into compelling narratives?